


The following report has been written by Chris Jones, Executive Vice President of Industry and Services at Descartes Systems Group.
In December 2023, US container import volume increased by 0.4% from November 2023. The slight aggregate increase masks counter intuitive swings in volume at West, East and Gulf Coast ports. The top East and Gulf Coast ports saw increases, while the top West Coast ports saw decreases.
The Panama drought did not appear to impact US container import volume at East and Gulf Coast ports in December, but port delay times increased particularly at Gulf Coast ports.
The Middle East shipping attacks escalated in December, but container import volumes do not appear to have impacted December.
The January update of the logistics metrics Descartes shows container import volume consistent with seasonal import patterns but signs that global supply chain performance will be under pressure in 2024 because of the conditions at the Panama and Suez Canals and upcoming labor negotiations.
US container imports grow slightly
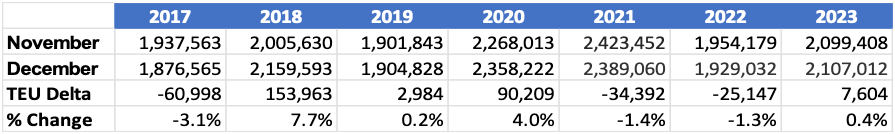
December 2023 US container import volumes increased by 0.4% from November 2023 to 2,107,012 TEUs (Figure 1). Versus December 2022, TEU volume was higher by 9.2%, and up 10.6% from pre-pandemic December 2019. The growth in import volume for all of 2023 is within 4.6% of the same period in 2019, but down 11.7% versus 2022.
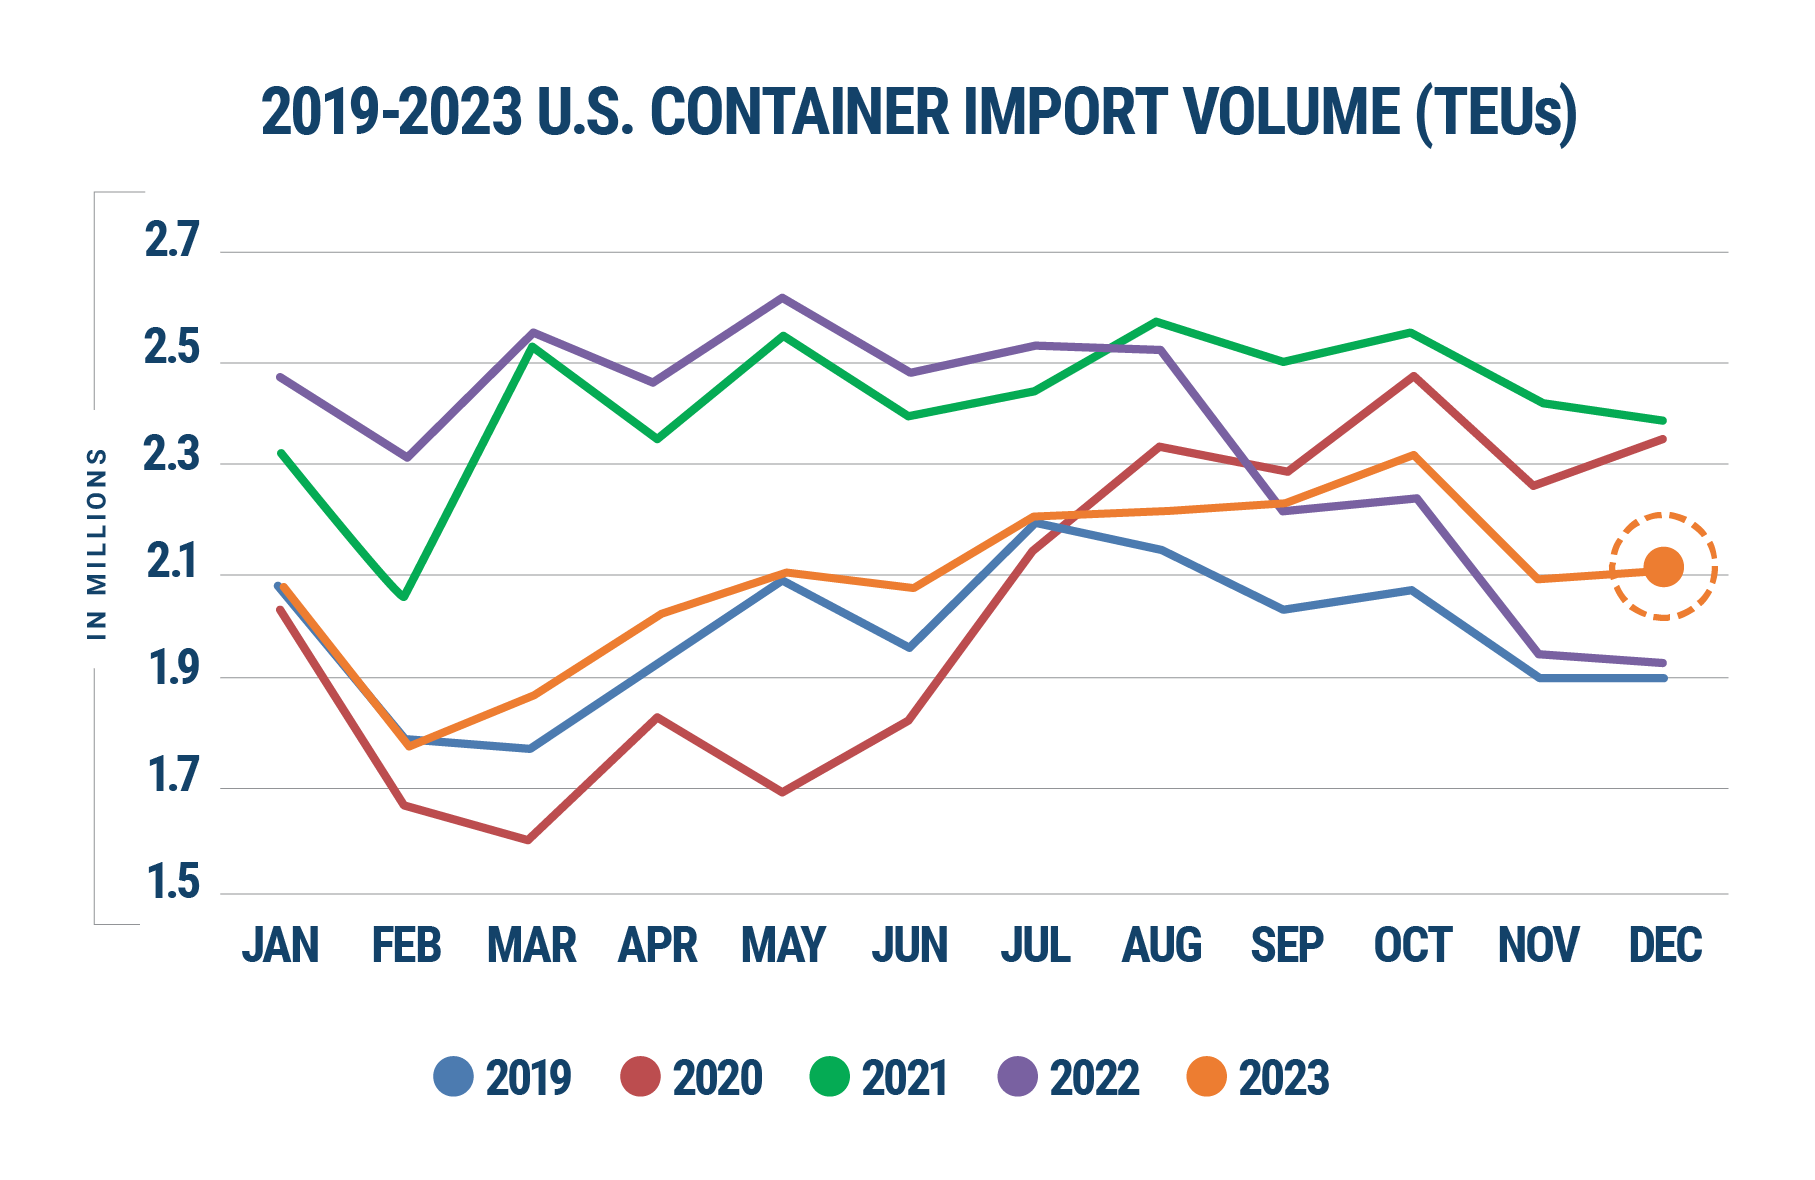
In the previous six years, import volume varied from slight declines to low growth from November to December with 2018 as the exception due to tariffs taking effect in 2019. December 2023 import volume maintained this pattern with a 0.4% increase from November (Figure 2).
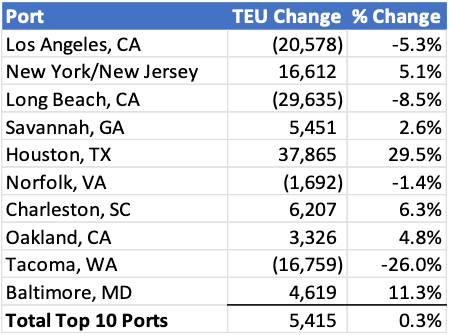
For the top 10 ports, overall US container import volume in December 2023 was up slightly by 5,415 TEUs versus November (Figure 3). The Port of Houston (37,865 TEUs) experienced the greatest container volume increase, while the Ports of Long Beach (-29,635 TEUs) and Los Angeles (-20,578 TEUs) had the greatest decreases.
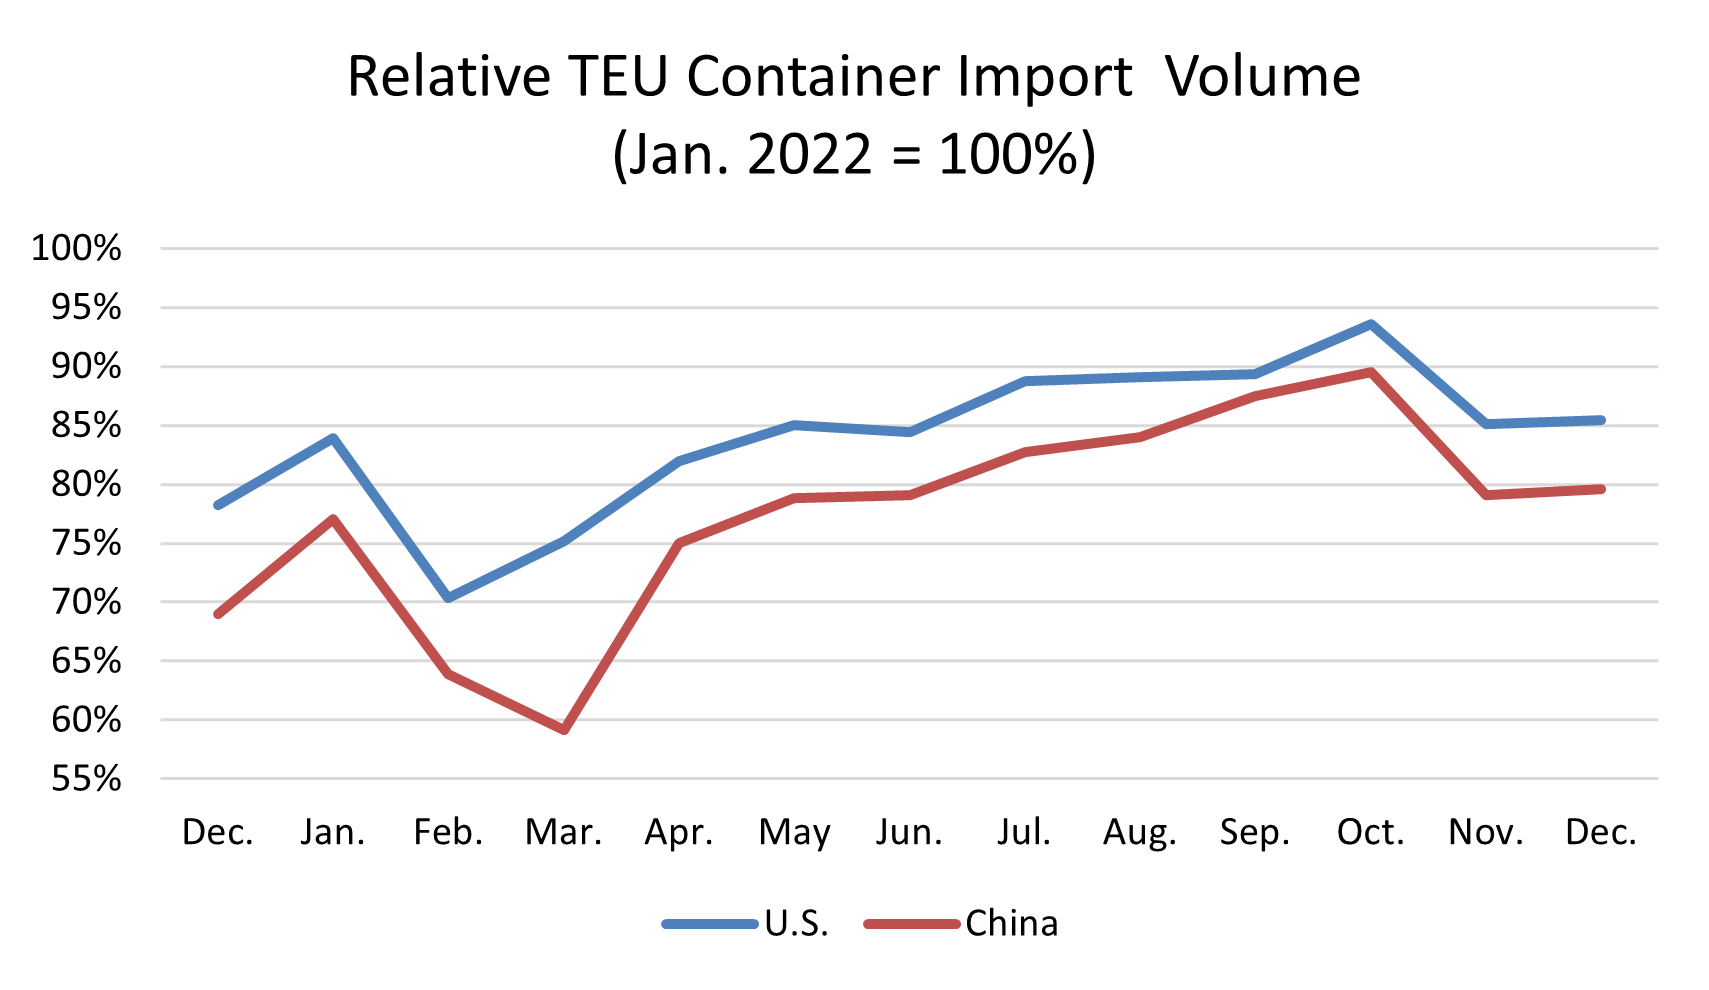
Chinese imports in December 2023 increased by 0.6% over November 2023 to 788,089 TEUs, but they were still down 21.5% from the August 2022 high (Figure 4). China represented 37.4% of the total US container imports in December, an increase of 0.1% from November, still down 4.1% from the high of 41.5% in February 2022.
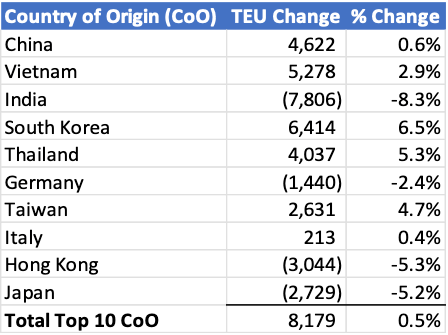
For the top 10 countries of origin (CoO), US container import volume in December 2023 increased 0.5% (8,179 TEUs) from the previous month, with South Korea having the greatest volume increase (6,414 TEUs) and India (-7,806 TEUs) having the largest volume decrease (Figure 5).
Market share flips back to top East and Gulf Coast ports
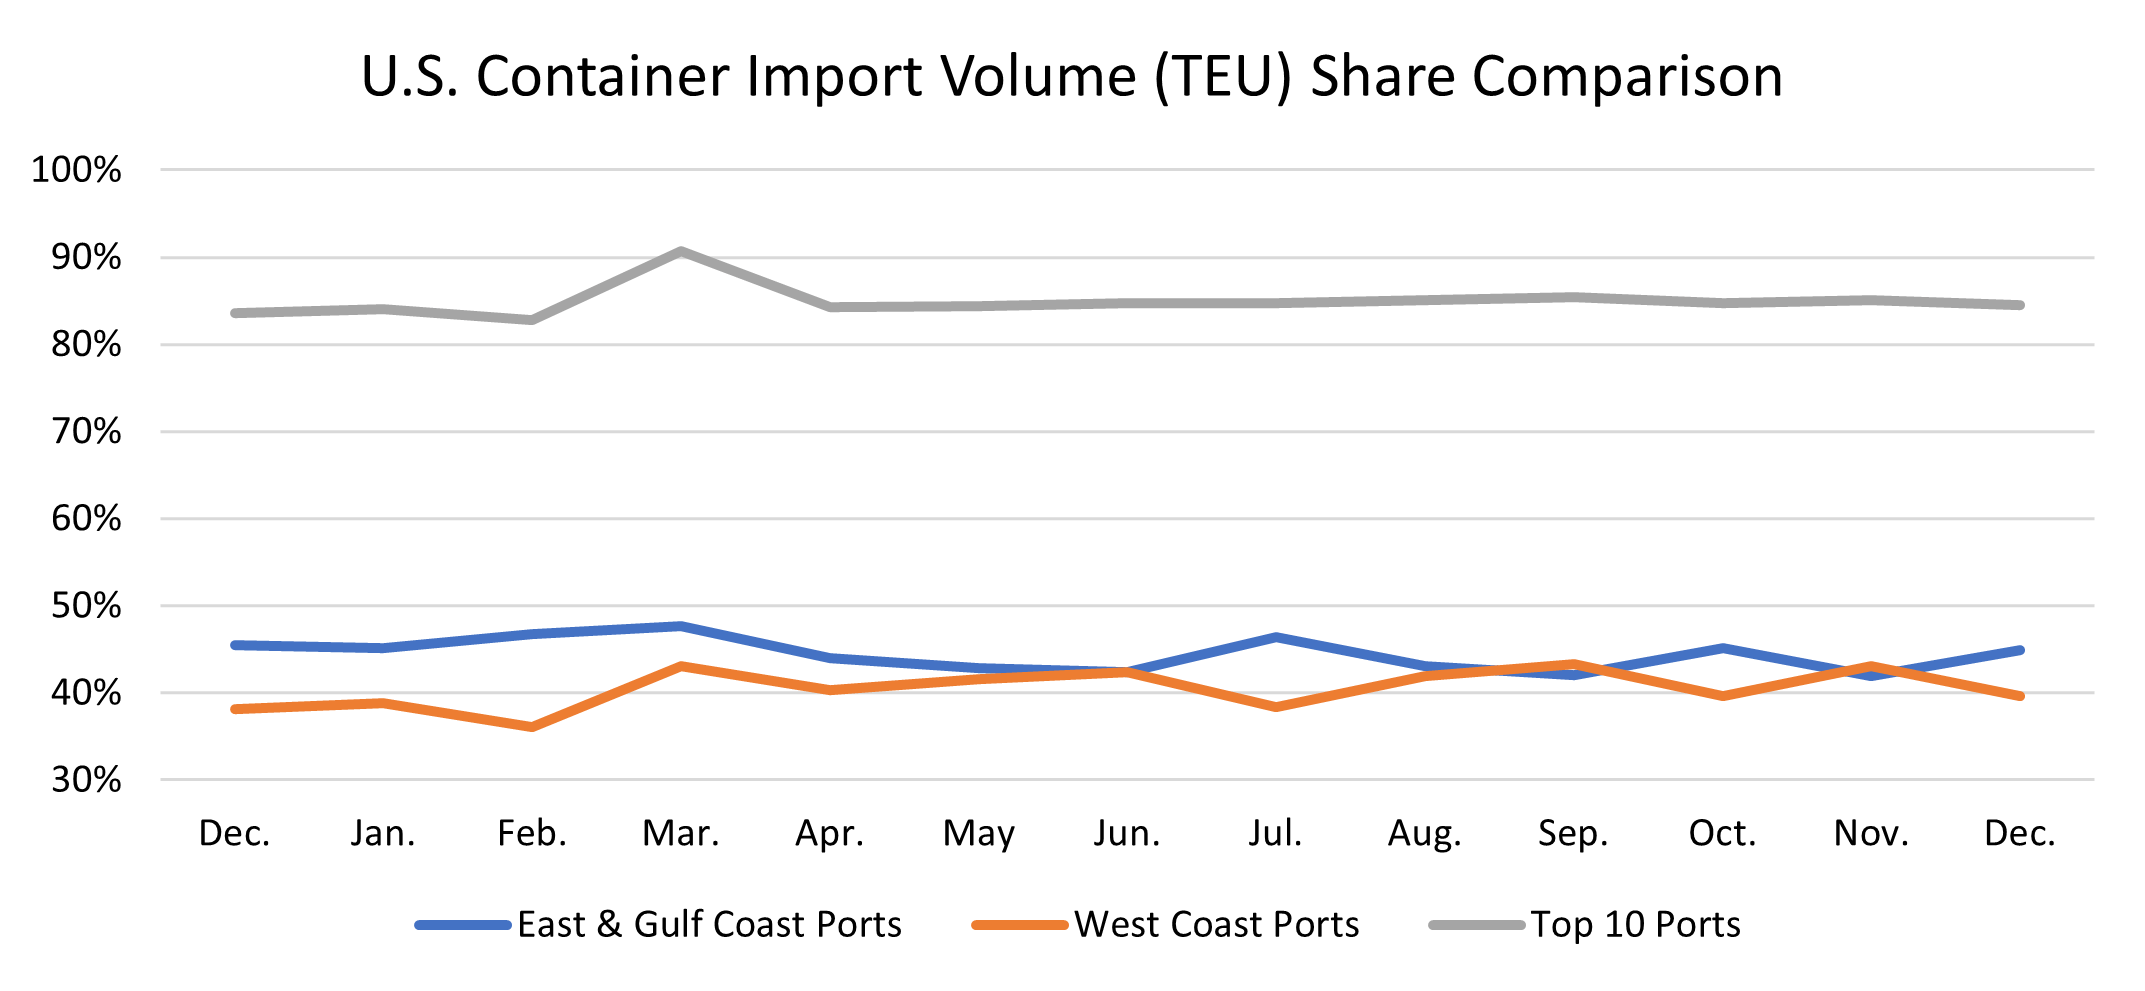
In December 2023, the volume share at top East and Gulf Coast ports increased based upon the significant volume increase at the Port of Houston and large decreases at the Ports of Long Beach and Los Angeles. Comparing the top five East and Gulf Coast ports to the top five West Coast ports in December 2023 versus November 2023 shows that, of the total import container volume, top East and Gulf Coast ports increased to 44.9% (up 2.9%) and top West Coast ports decreased to 39.7% (down 3.4%). Compared to smaller ports, the top 10 ports’ share in December 2023 decreased to 84.5%, down slightly (0.6%) versus November 2023 (Figure 6).
December port transit delays increase for top West and Gulf Coast ports
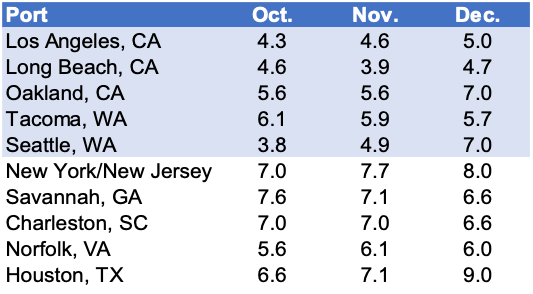
Overall port transit delays in December 2023 increased (see Figure 7). The top West Coast ports had increases across the board, despite large volume declines at the Ports of Long Beach, Lost Angeles and Tacoma. The port of Houston also experienced a significant transit time increase, while most of the East Coast ports saw slight decreases.
The drought in Panama remains, but its impact on US container import volumes is mixed
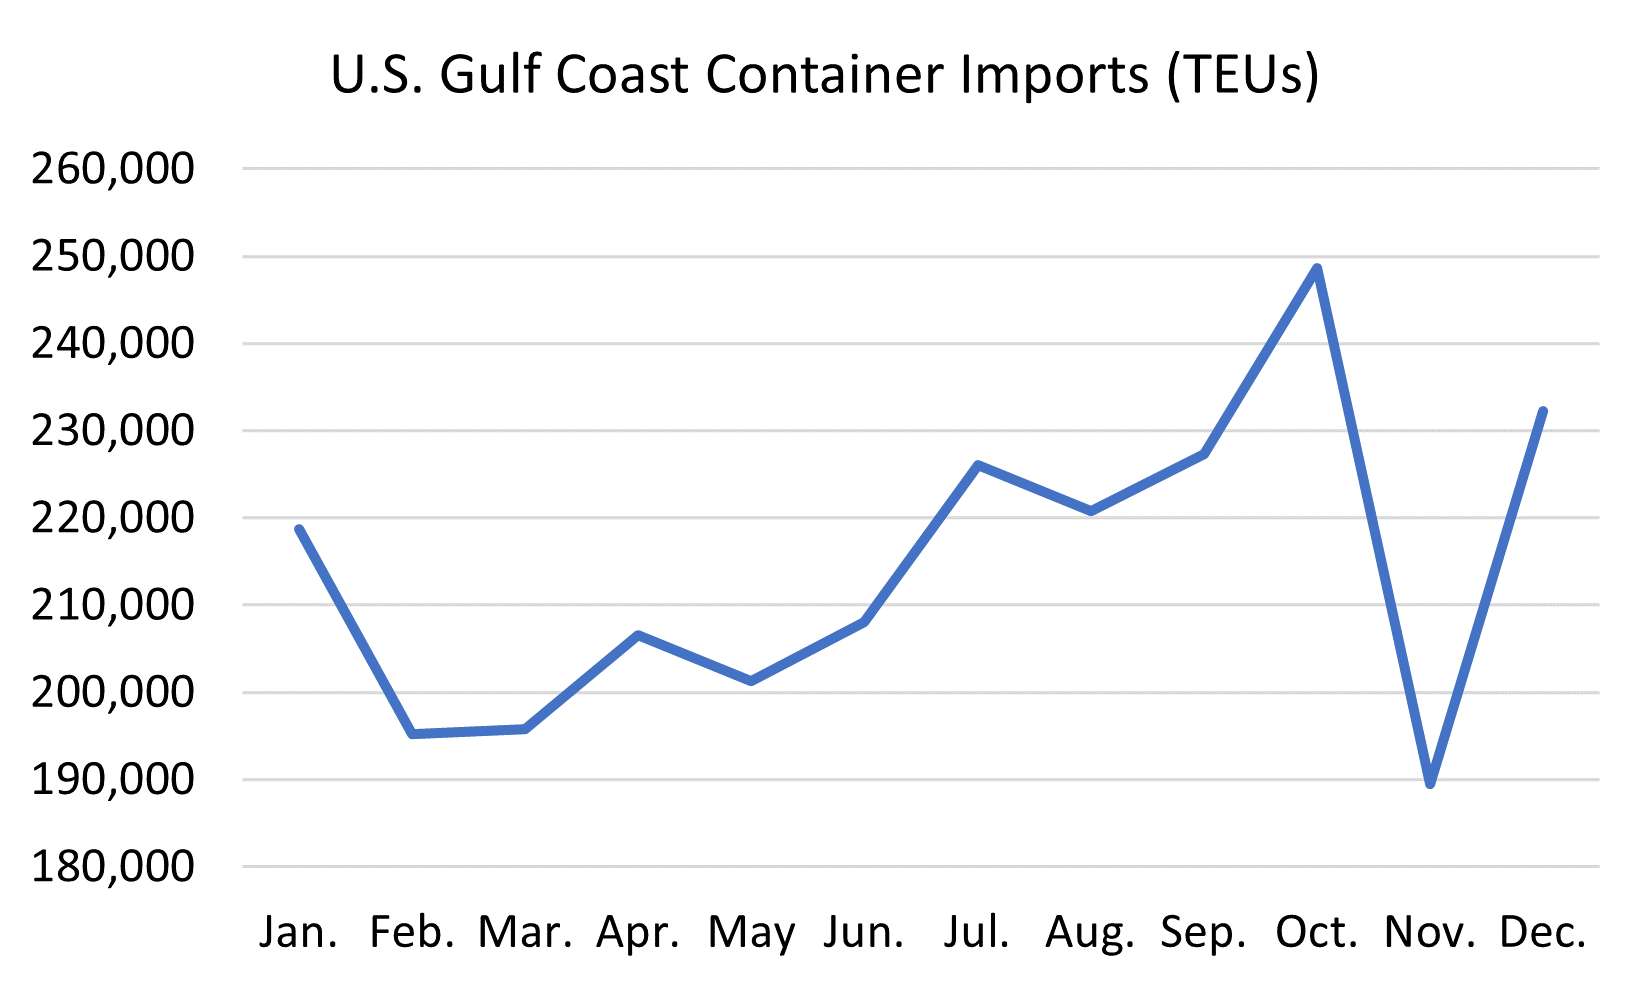
Panama’s drought continues and shipping volume through the Panama Canal remains depressed. While November had a large drop, December Gulf Coast container volumes recovered significantly (see Figure 8). Overall US container import volume was up 0.4%, but the port of Houston was up significantly (29.5%). Top East Coast ports’ volumes were also up (Charleston: 6.3% and New York/New Jersey: 5.1%). However, port transit times for top Gulf Coast ports increased by 2 days on average with the Port of Houston rising to 9.0 days transit delay. However, three of the top four East Coast ports experienced transit time delay decreases and the Port of New York/New Jersey only experienced a modest gain (0.3 days).
When will we see the impact of the Middle East conflict?
The attacks on shipping in the Red Sea by the Houthi from Yemen are creating havoc for cargo moving through the Suez Canal which transits 25% to 30% of the global container shipping volume. A number of leading carriers have begun to circumnavigate Africa to avoid loss of ships. The extended sailing could increase transit delays by two weeks to routes that normally would travel through the Suez Canal and effectively curtails global shipping capacity by 10% to 15%. The December numbers do not indicate any impact yet, but that makes sense since the attacks escalated in December and carriers subsequently diverted a substantial number of ships. It is more likely that any impact will be seen starting in the January 2024 numbers.
A potential labor disruption at South Atlantic and Gulf Coast ports in 2024
The agreement between the International Longshoremen’s Association (ILA) and United States Maritime Alliance (USMX) is set to expire at the end of September 2024. A labor action would disrupt operations at South Atlantic and Gulf Coast ports and ILA leadership has stated that it will not extend the current agreement and told members to prepare for the possibility of a coast-wide strike in October 2024. Currently, there are no statements of progress from either organization.
Managing supply chain risk: what to watch in 2024
US container import volume increased slightly in December and continued to surpass 2019 numbers. The economy is still exceeding expectations, which indicates healthy import volumes. However, the challenges with the Panama drought, Middle East conflict and pending ILA contract negotiations point to further trade flow disruptions. Here’s what Descartes will be watching in 2024 to see if global supply chain performance will continue to improve:
- Monthly TEU volumes between 2.4M and 2.6M. This level will continue to stress ports and inland logistics until infrastructure can be enhanced. December U.S. container import volumes remained near 2.1M TEUs, which puts less pressure on ports.
- Port transit wait times. If they decrease, it’s an indication of improved global supply chain efficiencies capabilities or that the demand for goods and logistics services is declining. December port transit times increased with Gulf Coast ports seeing the largest gain.
- Continuing impact of the pandemic. The spread of COVID subvariants continues to add uncertainty to the trajectory of the pandemic and impact supply chains in unpredictable ways as different countries are affected at different times and for different durations. Another new variant of COVID is causing infection rates to rise, which has not yet impacted supply chains and logistics resources but needs to be watched throughout the year.
- The economy. The U.S. is an import-driven economy, so economic health is an important indicator of container import volumes. However, there are many indicators that continue to provide conflicting stories. As of January 3rd, the Federal Reserve borrowing rate remained at 5.3% to slow inflation which has dropped to 3.1% (as of December 2023). Yet, consumers continue to spend as the inflation adjusted personal consumption expenditures of durable goods continues to rise with November 2023 figures (latest available) being the highest again in the last two years.
- Panama Canal-based trade flow.The combination of the drought impacting capacity and the recently ratified International Longshore and Warehouse Union (ILWU) could accelerate the redirection of the one million TEUs that shifted from the West Coast ports during the pandemic. Container volume in December at top East and Gulf Coast ports rebounded compared to the overall volume reduction, but Gulf Coast port transit times increased significantly.
- Middle East conflict. Attacks on shipping in the Red Sea by Houthis from Yemen could cause carriers to forego the Suez Canal, extending transit times and negatively impacting global shipping capacity. Attacks escalated in December causing many carriers to divert shipping around Africa and those impacts could be felt starting in January.
- ILA/USMX contract negotiation.A potential strike on the South Atlantic and Gulf Coasts could disrupt U.S. container imports later in 2024. Given the current Panama Canal situation, shifting volume to West Coast ports could be extremely challenging or significantly extend transit times. No progress was cited in December.
Recommendations to help minimize global shipping challenges
December 2023 US container import volumes were slightly higher compared to November 2023, and were ~10% higher than November 2022 or 2019 numbers. Overall port transit times in December were higher than November numbers. Ongoing issues in Panama and the Middle East are creating pressure on global supply chains that could cause disruptions in 2024. Descartes will continue to highlight key Descartes Datamyne, U.S. government and industry data in the coming months to provide insight into global shipping.
Recommendation changes from previous Descartes Global Shipping Reports are in bold.
Short-term:
- Track the spread of COVID variants to determine when they will hit critical parts of the supply chain, especially in China.
- Track ocean shipments and carrier performance as there is still a considerable gap between original ETAs and actual ones.
- Track the Panama Canal situation as the drought may impact shipping capacity and timeliness and even cause rerouting of supply chains.
- Track the Middle East conflict as carriers have begun to divert shipping around Africa, and this will impact shipping capacity and timeliness.
- Evaluate the impact of inflation and the Russia/Ukraine and Israel/Hamas conflicts on logistics costs and capacity constraints. Ensure that key trading partners are not on sanctions lists.
- Evaluate the potential impact of an ILA strike in October 2024 on South Atlantic and Gulf Coast ports to determine alternate ports or trade lanes.
Near-term:
- For companies importing from Asia, reevaluate trade that was moved away from West Coast ports.
- For companies that have cargo moving through the Suez Canal, evaluate the impact of extended rerouting.
Long-term:
- Evaluate supplier and factory location density to mitigate reliance on over-taxed trade lanes and regions of the globe that have the potential for conflict. Density creates economy of scale but also risk, and the pandemic and subsequent logistics capacity crisis highlights the downside. Conflicts do not happen “overnight” so now is the time to address this potentially business disrupting issue.