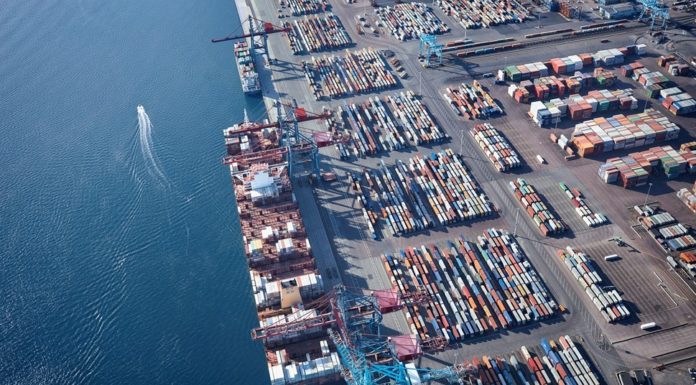
The Port of Gothenburg handled 885,000 TEUs in 2022, a 7% increase from the previous year with Maersk-owned operator, APM Terminals, handling the majority of the Swedish port’s container volumes.
The box throughput of the port also increased by 8% in the fourth quarter of the last year, marking the ninth consecutive quarter of growth.
In 2022, the whole Swedish container market remained constant and this indicates that the increased volume at the Port of Gothenburg represents a shift in market share from 50% to 53%. The Port of Gothenburg said that it also boosted its market share in comparison to adjacent large Northern European ports.
The port noted that container freight is frequently transported by rail to and from the port’s inland terminals around the country. The volume of rail-transported container freight climbed by 12% to 515,000 TEUs.
The rise is visible in both long-distance and short-distance rail operations, according to the port, with traffic to and from Northern Sweden showing the greatest increase. Additional rail operations, which have recently been agreed upon, will begin serving the port from all over Sweden in 2023.
Meanwhile, intra-European ro-ro traffic declined by 1% in 2022, despite the Port of Gothenburg’s market share increasing from 17 to 18%.
“Towards the end of 2022, we started to see a return to normal conditions in the logistics system after the years of pandemic accompanied by bottleneck problems, closures and shortages in both capacity and ships. With a coming recession and reduced global demand for transport activities, we are seeing an increasing global surplus of ships and equipment in many segments, which is affecting prices in the market,” stated Elvir Dzanic, CEO of the Gothenburg Port Authority.
Port of Gothenburg’s freight volumes 2022
| Full year 2022 | Full year 2021 | % Comp. | Q4 2022 | Q4 2021 | % Comp. | |
| Containers, TEUs | 885,000 | 828,000 | 7% | 230,000 | 212,000 | 8% |
| Rail, TEUs | 515,000 | 458,000 | 12% | 130,000 | 118,000 | 11% |
| Ro-ro units | 561,000 | 565,000 | -1% | 135,000 | 145,000 | -7% |
| New cars | 238,000 | 254,000 | -7% | 72,000 | 66,000 | 9% |
| Passengers | 1,414,000 | 765,000 | 85% | 258,000 | 224,000 | 15% |
| Cruise ship calls | 81 | 66 | 23% | 12 | 6 | 100% |
| Energy (million tonnes) | 22.3 | 19.1 | 16% | 5.8 | 4.4 | 33% |
| Dry bulk (thousand tonnes) | 375 | 256 | 47% | 91 | 73 | 25% |


